Spectral broadening with an increase in velocity (PSV >200cm/s, EDV > 0cm/s)
Vr greater than 3 across the stenosis
Principles
The velocity of blood flow is proportional to the frequency shift, which is heard as a change in pitch of the audio signal
Amplitude (loudness) is proportional to the volume of red blood cells moving through the Doppler signal path
Turbulence imparts a harsh quality to the signal via non-uniform velocities
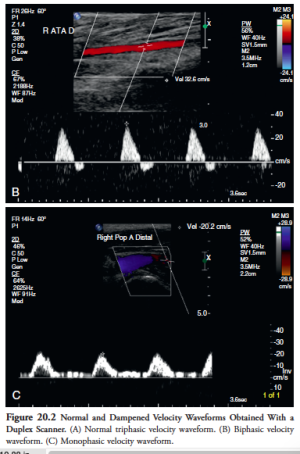
Contour of the waveform is also important
Normal arteries a triphasic or biphasic quality, with brisk upstroke in systole, a brief reverse stroke in diastole (caused by the reflection of the flow wave from the high resistance periphery), and mostly a small forward component in late diastole
When peripheral vascular resistance is low, the velocity waveform loses the reverse flow component and becomes monophasic with forward flow throughout the entire cardiac cycle
Arterial obstruction causes dampening of the waveform which becomes monophasic
Changes in stenosis
Early: spectral broadening (widening of the waveform in early diastole)
Late: increase in systolic velocity + spectral broadening
Critical: doubling of PSV when compared with adjacent segments, with blunted and monophasic segments distally
Proximal to the stenosis, you get a 'to and fro' pattern, as the resistance distally increases, and you get a large reflected wave
Technical
Colour-flow Doppler is the image with coloured velocities over the region - pixel encoding of blood flow. Set gain by increasing it until noise appears in the flow, then reducing it slightly. You don't want to see flow beyond the artery wall.
Arterial stenosis is seen as mosaicism within the lumen (turbulence) and reduction in colour-encoded flow in the lumen.
When you find a region of stenosis, put spectral Doppler on to quantify it.
Spectral Doppler is a graph of velocity over time, which can show quantitative velocity too
Should be at an angle of <60 degrees
Pulsatility index
Divide peak-to-peak velocity spectral shift by the mean velocity
Normal values:
Femoral >6
Popliteal >8
Normal peripheral arteries >4
PI < 4 may reflect proximal inflow/occlusive disease
Change in PI or spectral waveform damping is diagnostic of multilevel occlusive disease
'Damping factor'
Division of distal artery PI by proximal artery PI
<0.9 is diagnostic of occlusive disease
If assessment of mesenteric arteries is planned, should fast for 4 hours prior
Pressure differentials drive flow, and therefore decreased pressure results in decreased flow
In most instances, pressure is an acceptable surrogate measure for flow
Decreases in systolic pressure are more sensitive than changes in mean or diastolic pressure for detecting stenosis
Mild stenoses that do no cause a drop in pressure at rest may become evident when flow is increased
A pressure drop of 10mm Hg at rest or 15mm Hg after exercise/ischaemia/administration of vasodilators indicates increased resistance in this segment sufficient to reduce flow by a clinically meaningful account
Ankle-brachial index measurement
Simplest way to demonstrate lower extremity occlusive arterial disease. Detects stenosis >50%. Sensitivity 80-95%, specificity >95%.
Numerator: Place cuff as low as possible on the leg, above the ankle. Inflate above systolic pressure, then slowly deflate while the Doppler probe is held over PTA/DP (if no pressure here, can try lateral tarsal artery, just anterior and medial to the lateral malleolus). The ankle pressure is recorded as the highest pressure at which the Doppler signal returns.
Denominator: highest arm pressure at brachial artery
Patient should be supine for 5 minutes prior to measurement
ABI >1.3 should raise suspicion that the arterial wall is stiffened, as can occur in diabetes/CKD. Other reasons to suspect this in the patient with seemingly high ankle pressures:
Pulse not palpable
Monophasic waveform
Remainder of clinical picture strongly suggestive of PAD
Doppler signal diminishes while the ankle is elevated
Toe pressure measurements can be useful when you suspect calcified arteries, as they are less commonly calcified. Normal toe pressure is 20-40mm Hg less than ankle pressure. Toe-brachial index <0.7 is abnormal. Pressures of 30mm Hg or lower are a/w ischaemic symptoms. Foot lesions usually heal when the toe pressures are >50mm Hg, or slightly higher in diabetics.
Exercise testing:
Rest supine for 20 minutes then test ABI. Walk for 5 minutes or until symptoms prevent further exertion, then lie down and measure ABI again immediately and every 2 minutes for 10 minutes or until it returns to normal.
Clinically significant lower extremity PAD can be reliably ruled out in patients who can walk for the full five minutes without symptoms or a decrease in ABI.
This can also be done by induction of reactive hyperaemia (with a tourniquet) or with vasodilators, when walking is not possible